
Tuesday, April 23, 2013
Mystery of the Megaflood
We watched a movie called the mystery of the megaflood in lab and I found a summary of the movie from MSN Movies. It read, "Not so far back, an iconoclastic geologist began theorizing - in the face of hundreds of skeptics - that two million years ago, a titanic flood carved out the majority of present day Montana, Washington, Oregon and Idaho. His contemporaries turned their noses up and scoffed - until evidence surfaced to corroborate the scientist's theory: traces of an ancient ice dam alongside a Montana valley, which held in millions of gallons of water, until the dam itself melted - sending untold torrents across the Pacific Northwest and decimating everything in its path. NOVA: Mystery of The Megaflood, the acclaimed and multi-award winning WGBH series NOVA uses computer generated graphics to carry viewers into this ancient realm and study the enigmatic natural catastrophe that defined and sculpted broad vistas of our country. ~ Nathan Southern, Rovi”

Life Tables
We went to the Riverside Cemetery in Macon, Ga and collected data on people who died between 1917-1920 and another set of data on people that died 1960 between 1980 and created a life table for each.
1917-1920
1960-1980 life table:
1917-1920
|
X
|
X
|
X
|
X
|
Qx
|
|
0-1.9
|
5
|
0.178571429
|
1
|
0.178571429
|
|
2-9.9
|
3
|
0.107142857
|
0.821428571
|
0.130434783
|
|
10-19.9
|
4
|
0.142857143
|
0.714285714
|
0.2
|
|
20-29.9
|
2
|
0.071428571
|
0.642857143
|
0.111111111
|
|
30-39.9
|
3
|
0.107142857
|
0.535714286
|
0.2
|
|
40-49.9
|
2
|
0.071428571
|
0.464285714
|
0.153846154
|
|
50-59.9
|
2
|
0.071428571
|
0.392857143
|
0.181818182
|
|
60-69.9
|
3
|
0.107142857
|
0.285714286
|
0.375
|
|
70+
|
4
|
0.142857143
|
0.142857143
|
1
|
|
Total
|
28
|
1960-1980 life table:
X
|
Dx
|
dx
|
lx
|
Qx
|
|
0-1.9
|
5
|
0.12195122
|
1
|
0.12195122
|
|
2-9.9
|
4
|
0.097560976
|
0.87804878
|
0.111111111
|
|
10-19.9
|
3
|
0.073170732
|
0.780487805
|
0.09375
|
|
20-29.9
|
2
|
0.048780488
|
0.707317073
|
0.068965517
|
|
30-39.9
|
4
|
0.097560976
|
0.658536585
|
0.148148148
|
|
40-49.9
|
8
|
0.195121951
|
0.56097561
|
0.347826087
|
|
50-59.9
|
4
|
0.097560976
|
0.365853659
|
0.266666667
|
|
60-69.9
|
3
|
0.073170732
|
0.268292683
|
0.272727273
|
|
70+
|
8
|
0.195121951
|
0.195121951
|
1
|
|
total
|
41
|
Monday, April 22, 2013
Topography Map
A topographic map is a map that uses contour lines to describe elevation changes. Usually, they include bodies of water and other natural features.
Topographic maps are important because they are typically more accurate than a common map. They are also vital to engineers and architects to do their jobs.
This is a topographic map of Mount Blackburn in Alaska that I created using Google Earth:
Blue line is 5,000 ft
Red line is 5,000 ft
Green line is 6,000

Thursday, April 4, 2013
Flood of ‘94
In the beginning of July 1994, there was a flood in the central Georgia area. Some areas in georgia received 21 inches of rain. The levees of the Ocmulgee River breached and caused a lot of damage to the area. The flood ended up causing 18 people to lose their life. The flood also caused both interstates 75 and 16 to be closed off which had never happened before. The flood became known as the “killer flood” and Georgia had never seen anything like it. Statewide damage was estimated to be $58 million dollars not including business and residential damages.
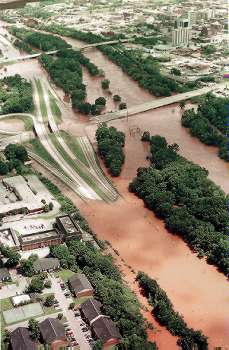

In 1994 I lived in Warner Robins, Ga. I was only 2 years old but I remember hearing stories about the flood long after it happened. My parents said they took me to see the river a day before it flooded. Thankfully my house was not harmed by the flood.
Subscribe to:
Comments (Atom)